Energy Efficiency & Quality Assurance
Refineries, chemical plants, food processors, breweries and manufacturers across the New Orleans corridor are quietly losing tens of thousands of dollars a year to damaged, missing or under-spec mechanical insulation. We measure exactly how much — and prove the savings before you spend a dollar.
The Premise
Mechanical Insulation isn't a Purchase. It's an Investment.
Mechanical insulation degrades silently. You won't see it on a P&L line — but your fuel bill does. Here's where the money is going.
Stripped jackets, crushed lagging, valves and fittings left bare after maintenance. Each uninsulated valve on a 250 °F line wastes the equivalent of 15–25 feet of bare pipe — every hour, every day, for years.
Insulation installed decades ago to the wrong code. Modern energy codes call for substantially thicker insulation on high-temperature lines. The pipe is "covered" — but it's still bleeding heat into the building 24/7.
Gaps at fittings, unsealed seams, missing vapor stops, removable covers that never get reinstalled. A correctly-spec'd job installed badly delivers a fraction of the projected savings — and the difference shows up in your fuel bill, not the contractor's invoice.
Mechanical insulation is one of the only capital improvements in your plant where the quality of installation determines whether you see 90% of the projected savings — or 30%. The materials are commodities. The engineering is well-understood. The variable is craftsmanship.
That's why we only work with Qualified Contractors, why every audit is modeled in NAIMA 3E Plus, and why every completed project gets a QC verification visit. The savings on this page aren't projections — they're what the math says happens when the job is done right.
Insulation isn't an expense line. It's a capital project with a sub-2-year payback and a 20-year useful life. Treat it like one and your plant will pay for it many times over.
A recent walk-down assessment of a small 26.1 Megawatt Power House, made up of three coal-fired units, serving a major industrial facility in the Midwest. The numbers below come straight from a NAIMA 3E Plus model of every exposed component on site — 189 individual items inventoried, photographed, measured and analyzed.
Confidential · Midwest USA · Natural gas · 189 items inventoried
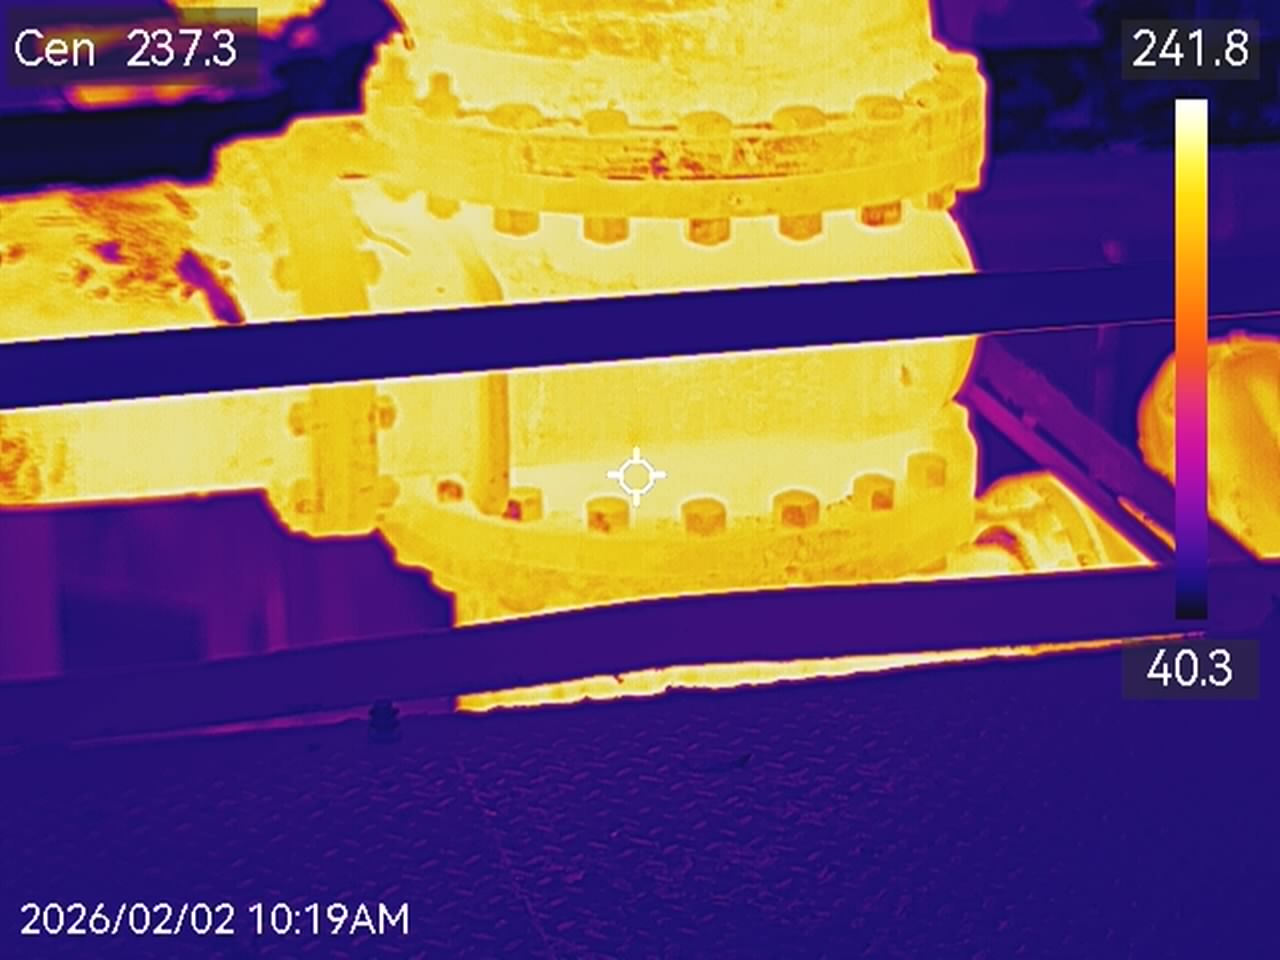
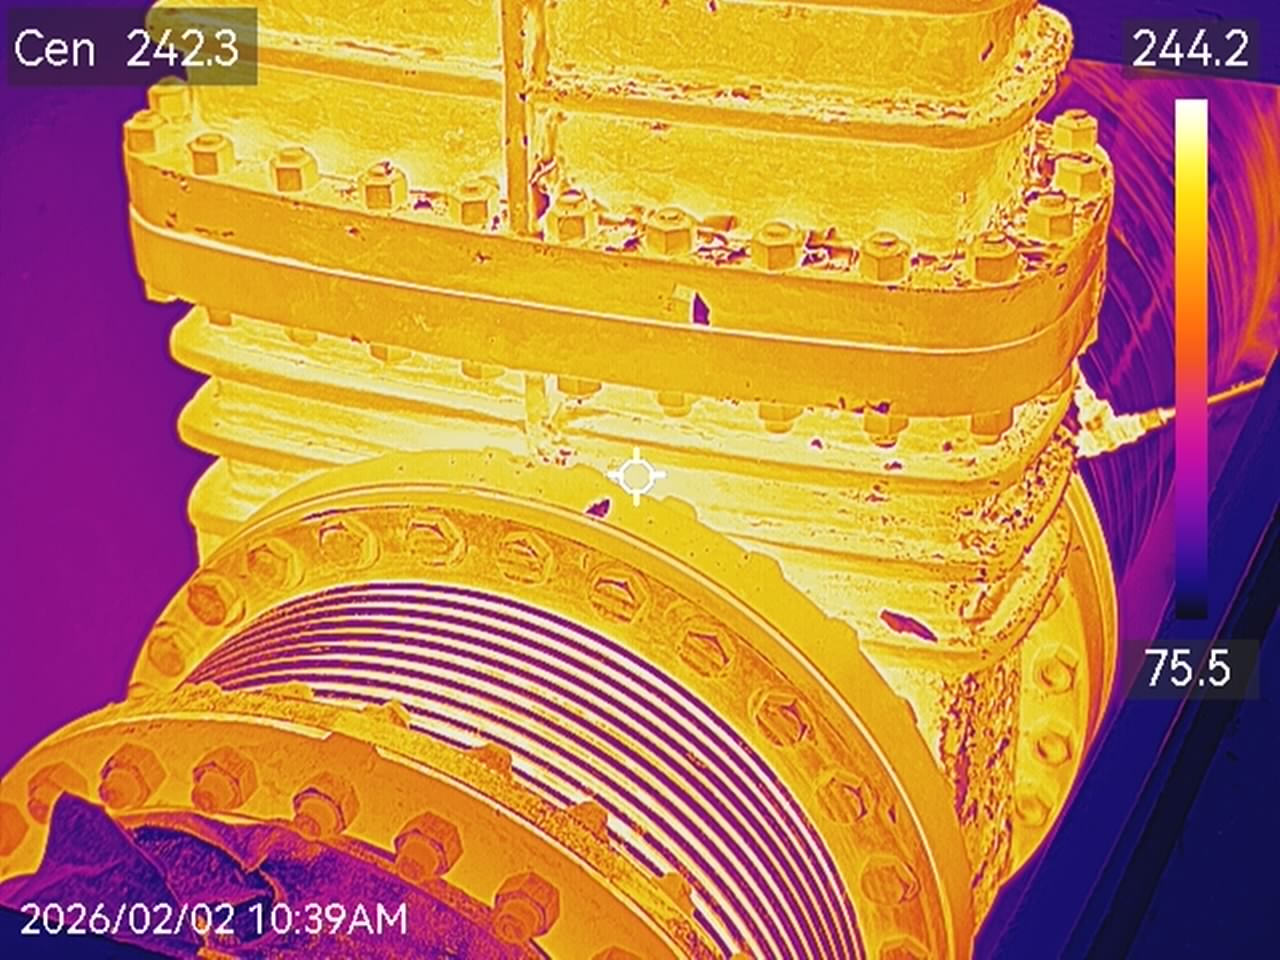
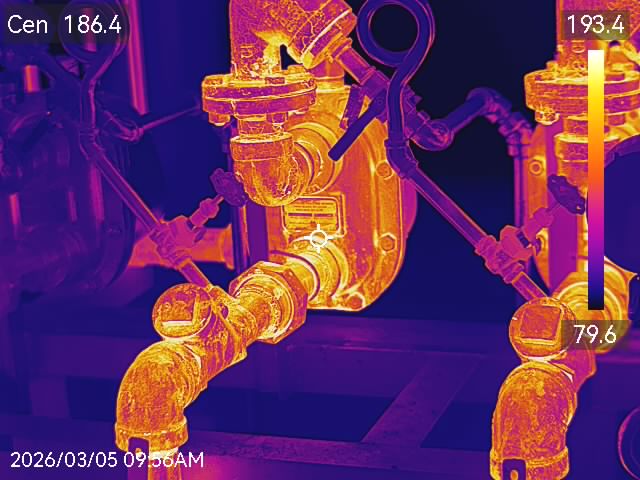
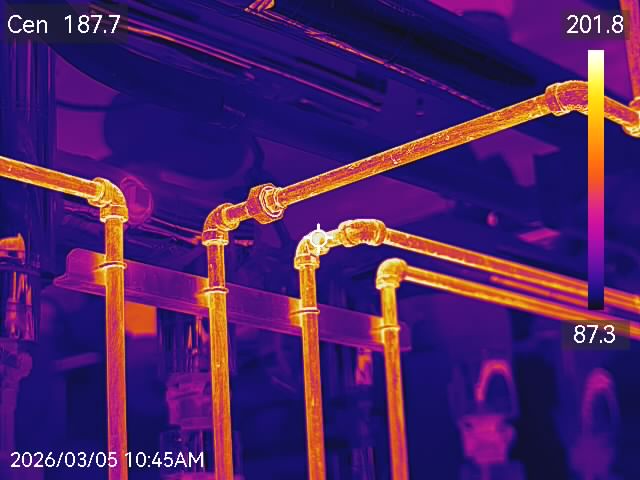
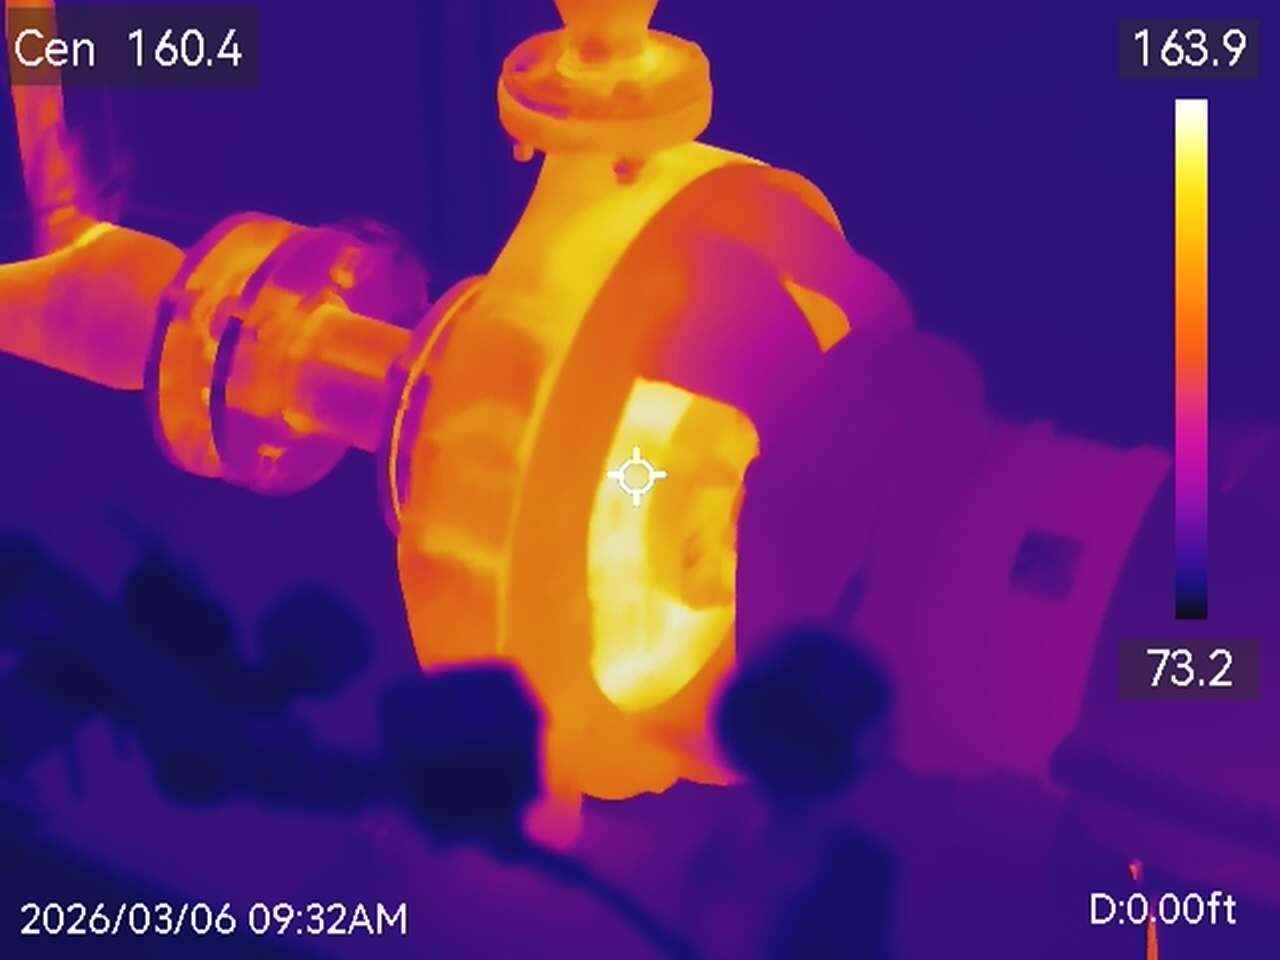
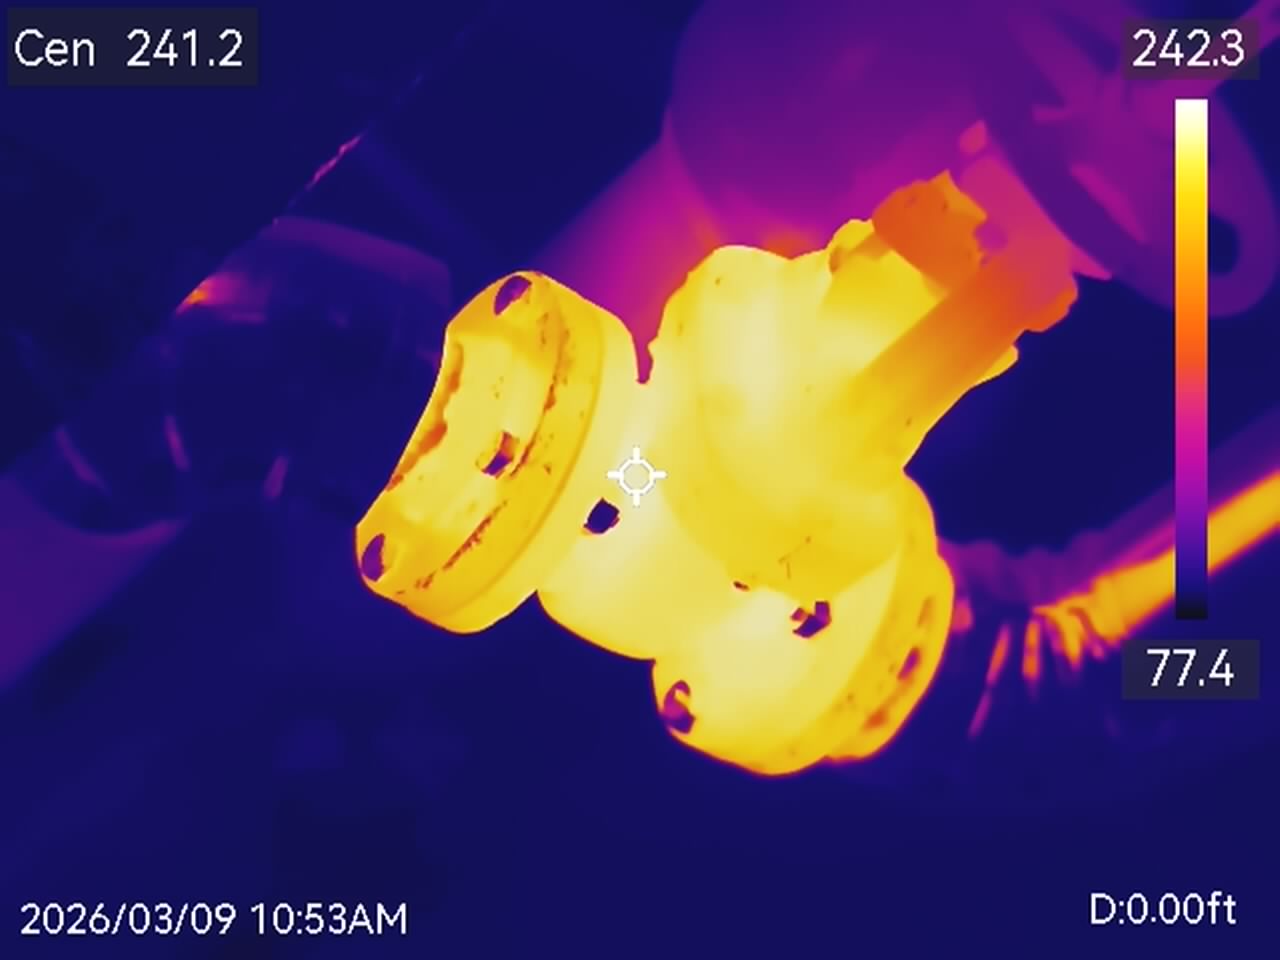
The walk-down identified 189 individual items — pipe runs, valves, fittings, flanges, pumps, condensate equipment and steam traps — that were either uninsulated, under-insulated, or had failed lagging. Each was photographed in the visible spectrum and with an infrared camera, then logged with pipe size, operating temperature, and current condition.
NAIMA 3E Plus modeled the heat loss for every component in both its current state and after a properly-spec'd upgrade. The result: a $29,818/yr reduction in operating cost on natural gas alone, paired with a 4,591.9 MMBtu/yr reduction in heat flow into the building. Over a conservative five-year horizon — well inside the useful life of the materials — that's $149,092 the facility currently hands to its fuel supplier instead of keeping on the balance sheet.
The single most striking finding was how much of the loss came from a relatively small number of high-temperature valves and flanges. The thermal images below tell the story better than any spreadsheet can.
If your facility runs steam, hot water, hot oil, refrigerated brine, or chilled process fluids — and you have miles of piping, hundreds of valves, and a fuel bill you'd like to cut — we should talk.
Process heat, steam tracing, hot oil systems
Reactor jackets, distillation, utility steam
Steam, hot water, CIP loops, refrigeration
Brewhouse Steam, glycol, mash & wort lines
Process heat, plant steam, glycol systems
Hospitals, universities, district energy
Every number you've seen on this page comes from this exact process. It's non-invasive, takes a few days on site, and costs you nothing.
Infrared cameras identify every uninsulated or damaged component — pipes, valves, fittings, flanges, tanks, pumps, steam traps. Nothing is missed.
Each item is cataloged: pipe size, operating temperature, current insulation condition, location, and quantity — photographed in visible and IR spectra.
NAIMA 3E Plus calculates heat loss for each component in both current and upgraded states, using your site's actual fuel cost, efficiency and hours.
An interactive report shows every item, system-level summaries, total annual savings, CO₂ & NOₓ reductions, and the exact upgrades that drive the biggest payback.
Your EEQA representative solicits bids from our Qualified Contractors. Allow 4–6 weeks for bidding. A Final Report follows when work is complete.
After installation, a QC visit confirms every item meets specification — so the projected savings are the savings you actually get.
Our walk-through audits cost nothing to the client and routinely uncover savings that pay for the entire upgrade in under two years. Let's start with a single building, a single steam loop, or a single powerhouse — and prove it with your own numbers.